Call
the concentration of the taint in the cream x, and in the steam
y, both as mass fractions,
From
the condition that, at equilibrium, the concentration of the taint in
the steam is 10 times that in the cream:
10x = y
and in particular,
10x1 = y1
Now,
y1 the concentration of taint in the steam leaving the
stage is also the concentration in the output steam
y1 = ya = 10x1
The incoming steam
concentration = y2 = 0 as there is no taint in the entering
steam.
The taint concentration
in the entering cream is xa = 8 ppm.
These are shown diagrammatically
in Fig. 9.3.
Basis is 1 kg of cream

Figure 9.3 Flows into and out from a stage
The problem
is to determine x1 the concentration of taint in the
product cream.
The
mass ratio of stream flows is 1 of cream to 0.75 of steam and if no steam
is condensed this ratio will be preserved through the stage.
1/0.75 = 1.33 is the ratio of cream flow rate to steam flow rate = L/V.
Applying eqn. (9.6)
to the one stage n = 1,
y2 = x1L/V + ya
- xaL/V
y2 = 0 = x11.33 + 10x1
- 8 x 1.33
x1 = 10.64/11.33
= 0.94 ppm
which is the concentration
of the taint in the leaving cream, having been reduced from 8 ppm.
This
simple example could have been solved directly without using the formula,
but it shows the way in which the formula and the equilibrium conditions
can be applied.
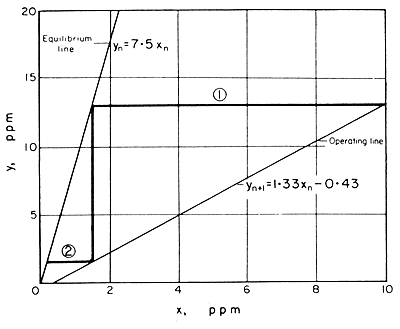
Based
on the step-by-step method of calculation, it was suggested by McCabe
and Thiele (1925) that the operating and equilibrium relationships
could very conveniently be combined in a single graph called a McCabe-Thiele
plot
The
essential feature of their method is that whereas the equilibrium line
is plotted directly, xn against yn,
the operating relationships are plotted as xn against
yn+1. Inspection of eqn. (9.5) shows that it gives yn+1
in terms of xn and the graph of this is called the operating
line. In the special case of eqn. (9.6), the operating line is a straight
line whose slope is L/V and whose intercept on the y-axis is (ya
- xaL/V).
Considering
any stage in the process, it might be for example the first stage, we
have the value of y from given or overall conditions. Proceeding
at constant y to the equilibrium line we can then read off the
corresponding value of x, which is x1. From x1
we proceed at constant x across to the operating line at which
the intercept gives the value of y2. Then the process
can be repeated for y2 to x2, then
to y3, and so on. Drawing horizontal and vertical lines
to show this, as in the Fig. 9.4, a step pattern is traced out
on the graph. Each step represents a stage in the process at which contact
is provided between the streams, and the equilibrium attained. Proceeding
step-by-step, it is simple to insert sufficient steps to move to a required
final concentration in one of the streams, and so to be able to count
the number of stages of contact needed to obtain this required separation.
[Fig. 9.4 both illustrates the general process, with two stages, and also
gives numerical data to solve later Example (9.5) of a two-stage steam
stripping/gas absorption process].

Figure 9.4 Steam stripping: McCabe-Thiele plot
On the graph of Fig. 9.4 are shown the operating line,
plotting xn against yn+1, and the
equilibrium line in which xn, is plotted against yn.
Starting from one terminal condition on the operating line, the stage
contact steps are drawn in until the desired other terminal concentrations
are reached. Each of the numbered horoizontal lines represents one stage.This
procedure is further explained in Example
9.5.
 Contact-Equilibrium
Processes - Part 2: APPLICATIONS > GAS ABSORPTION Contact-Equilibrium
Processes - Part 2: APPLICATIONS > GAS ABSORPTION
 Back
to the top Back
to the top |
![]() EXAMPLE
9.4. Single stage steam stripping, of taints from cream
EXAMPLE
9.4. Single stage steam stripping, of taints from cream 

